one of the most used metrics by investors and analysts, for getting clear picture on stock future is pe ratio.
For past few days I was getting suggested video in YouTube and reels in Instagram on pe ratio. After watching I realized that this metric is very important for proper and clear understanding about a stock. Now in this blog we try to see what is pe ratio in simple.
What is pe ratio
For instance, if a stock has PE ratio as 15. This means investors paying Rs.15 in that stock for every Rs.1 that company current earnings.
In simple words, PE ratio tells us how much money investors are willing to invest in a single share in a company for Rs.1 earned by it.
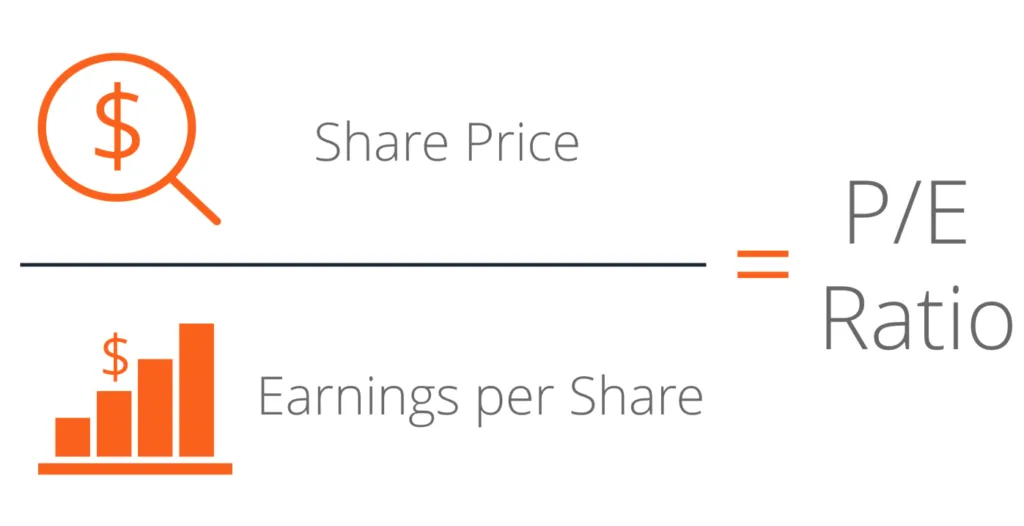
Formula,
pe ratio = Current price / Earnings per share.
Higher and lower pe ratio
If a stock is overvalued or in a way to more growth or expected to increase in future, higher pe ratio can be witnessed in this. And we can predict that investors are willing to pay higher value for this stock. The vice-versa situation is for low pe ratio. The share which has lower pe ratio, may undervalued or investors are not or poor expecting in future for particular company.
Types of pe ratios
This metrics has two types one is forward pe ratio which works on the values by future earnings guidance. Here it will consider future earnings guidance values, which may or may not be accurate.
Other one is trailing pe ratio, this is mostly used type. It takes past earnings of the company for a period of time and predict value for future. Trailing type may give accurate results about company’s performance.
Which pe ratio is best
Now final and important part is which value of pe ratio is best, this will change from stock to stock, industry to industry. If we want to find is the pe ratio for this stock is good or not, compare with peer company and total industry pe ratio value. By the results of that comparisons, we can decide is this good value or not. Along with pe ratio, check other metrics before taking a call.
Where to find pe ratio of stock.
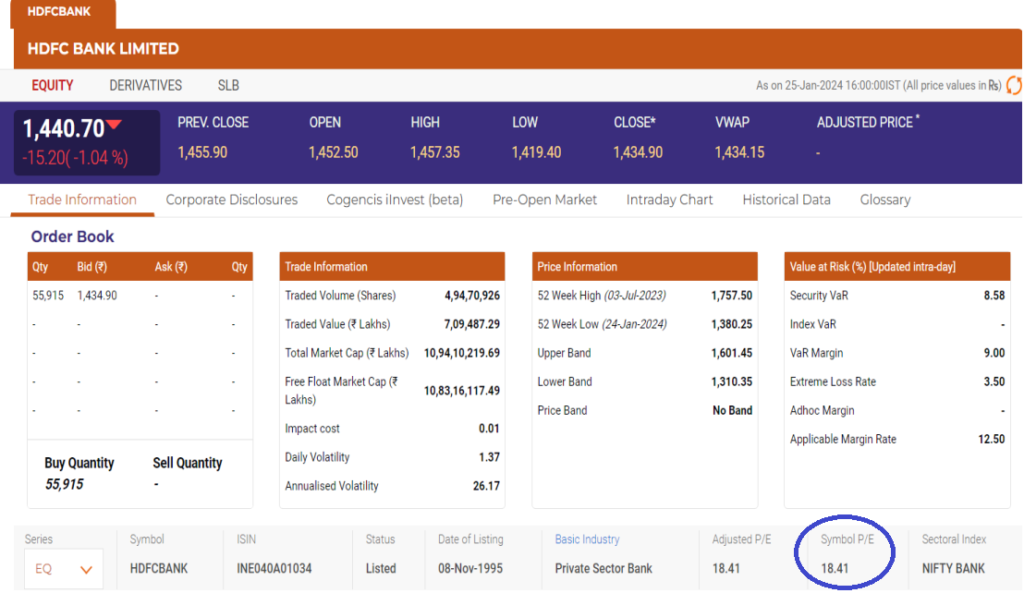
We can find pe ratio of a stock in NSE https://www.nseindia.com/ website for Indian stocks. Type the company name in search box, and you will get total company profile and different stats.
Here is an example of image of HDFC BANK LIMITED, the circle one is the pe ratio of stock.